Widgets
A widget is ready-made content, such as a gauge, a chart, a table or a list.
You write a widget on the screen in the same way as text. A widget takes a
position, a size, a border and a title, as text does. canvas.write() is the
same as canvas.screen.write(), and canvas.render() is the same as
canvas.screen.render().
The widgets are in xnano.widgets. xnano draws them with
ratatui, a Rust library for terminal
programs. Each section of this guide links to the ratatui widgets that draw the
xnano widgets. The ratatui pages show more examples and all the options.
Gauges
A Gauge fills a bar to a ratio from 0 to 1 and shows a label on the bar.
A LineGauge shows the same ratio on one line. xnano draws them with the
ratatui widgets Gauge and LineGauge.
import xnano
from xnano.styles import Style
from xnano.widgets import Gauge, LineGauge

with xnano.new(width=48, height=4) as canvas:
    canvas.write(
        Gauge(0.62, label='62% of 512 GB', gauge_style=Style('green')), width='100%'
    )
    canvas.write(
        LineGauge(0.35, label='upload', filled_style=Style('cyan')), width='100%', y=2
    )
    print(canvas.render(format='ansi'))


Sparklines and bar charts
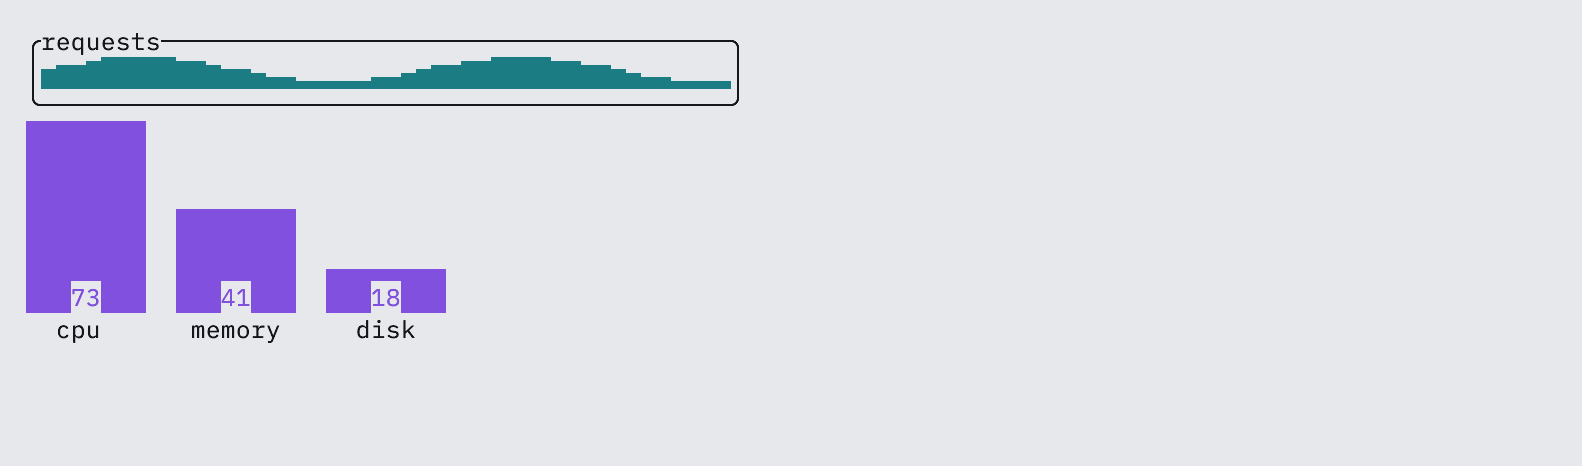
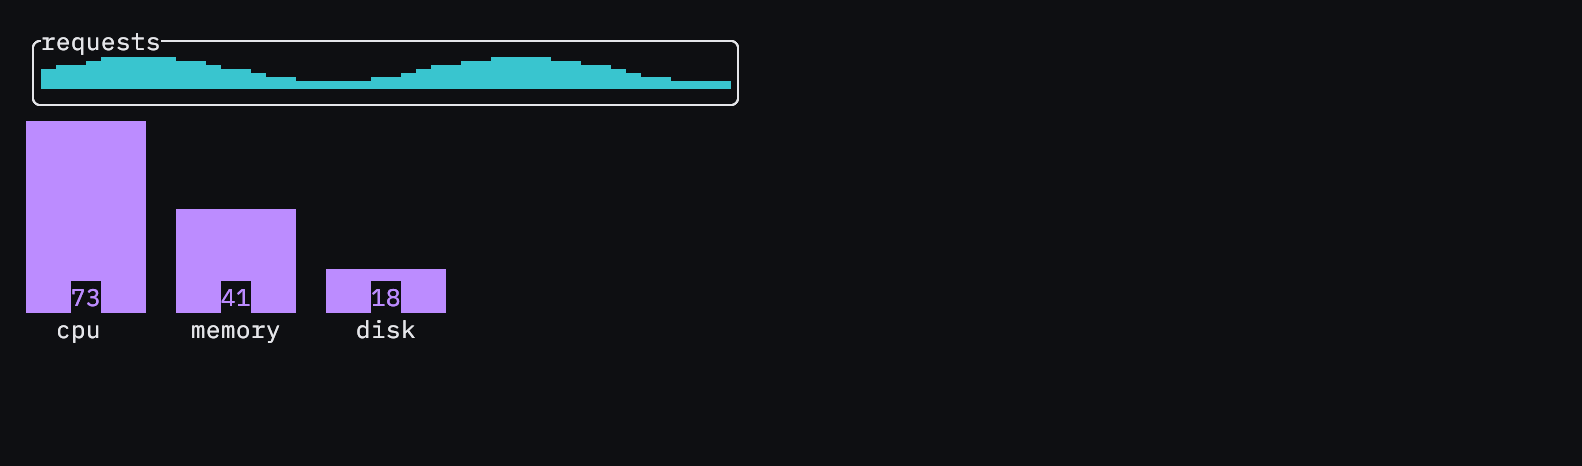
A Sparkline shows a series of values as bars that are one cell wide. It shows
the shape of the series in a small area. A BarChart shows bars, and each
Bar has a value and an optional label. xnano draws them with the ratatui
widgets Sparkline, BarChart and
Bar.
import math

import xnano
from xnano.styles import Style
from xnano.widgets import Bar, BarChart, Sparkline

requests = [round(6 + 3 * math.sin(second / 4)) for second in range(46)]

with xnano.new(width=48, height=11) as canvas:
    canvas.write(
        Sparkline(requests, style=Style('cyan')),
        width='100%',
        height=3,
        border='rounded',
        title='requests',
    )
    canvas.write(
        BarChart(
            [Bar(73, label='cpu'), Bar(41, label='memory'), Bar(18, label='disk')],
            bar_width=8,
            bar_gap=2,
            bar_style=Style('magenta'),
        ),
        width='100%',
        height=7,
    )
    print(canvas.render(format='ansi'))
Tables
A Table takes its rows as lists of cells. To style a full row, for example
the header, use a TableRow. To style one cell, use a TableCell. xnano draws
them with the ratatui widgets Table, Row and
Cell.
import xnano
from xnano.styles import Style
from xnano.widgets import Table, TableCell, TableRow

with xnano.new(width=48, height=6) as canvas:
    canvas.write(
        Table(
            [
                ['web', 'up', '41 ms'],
                ['api', 'up', '12 ms'],
                ['db', TableCell('down', style=Style('red')), '—'],
            ],
            header=TableRow(['service', 'status', 'p95'], style=Style(bold=True)),
        ),
        width='100%',
        border='rounded',
        title='services',
    )
    print(canvas.render(format='ansi'))


Lists and tabs
An ItemList shows a list of items. selected sets the selected item, and
highlight_symbol and highlight_style mark it. Tabs shows a row of titles,
and selected sets the selected title. xnano draws them with the ratatui
widgets List and Tabs.
import xnano
from xnano.styles import Style
from xnano.widgets import ItemList, Tabs

with xnano.new(width=48, height=6) as canvas:
    canvas.write(
        Tabs(
            ['mail', 'calendar', 'contacts'],
            selected=0,
            highlight_style=Style('yellow', bold=True),
        ),
        width='100%',
    )
    canvas.write(
        ItemList(
            ['inbox', 'drafts', 'sent', 'archive'],
            selected=1,
            highlight_symbol='› ',
            highlight_style=Style(reverse=True),
        ),
        height=4,
        y=2,
    )
    print(canvas.render(format='ansi'))


Change a widget
A widget stays live after you write it, like a placement. Set one of its
values, and the next frame shows the change. For example, selected of an
ItemList moves the highlight, and ratio and label of a Gauge change its
bar and its text. This list follows the arrow keys:
import xnano
from xnano.styles import Style
from xnano.widgets import Gauge, ItemList

folders = ['inbox', 'drafts', 'sent', 'archive']
unread = {'inbox': 12, 'drafts': 3, 'sent': 0, 'archive': 48}

with xnano.open(height=6) as terminal:
    items = ItemList(
        folders, selected=0, highlight_symbol='› ', highlight_style=Style(bold=True)
    )
    share = Gauge(unread['inbox'] / 48, label='12 unread')
    terminal.write(items, width=20, height=4)
    terminal.write(share, x=20, y=0, width=20, height=1)
    terminal.write('↑ ↓ choose · q quit', y='bottom', dim=True)

    @terminal.hook(on='key', keys=['up', 'down'])
    def choose(context: xnano.Context):
        step = 1 if context.keyboard.key == 'down' else -1
        items.selected = (items.selected + step) % len(folders)  # >> [selected]
        count = unread[folders[items.selected]]
        share.ratio = count / 48  # >> [gauge]
        share.label = f'{count} unread'  # >> [gauge]

    terminal.run(stop_on='q')
Moves the highlight one item up or down. % takes it from the last item to the
first item, and back.
The gauge shows the folder that is selected. You do not write the gauge again.
Widgets that follow the clock
Each number and text in a widget can be an expression. xnano calculates an expression again on each frame. This gauge fills in ten seconds, and it needs no hook:
import xnano
from xnano.widgets import Gauge

with xnano.open(height=2) as terminal:
    terminal.write(Gauge(terminal.clock / 10), width='100%')
    terminal.write('q quit', y='bottom', dim=True)
    terminal.run(stop_on='q')


More widgets
xnano.widgets has more widgets:
| Widget | What it shows | ratatui widget |
|---|---|---|
Chart |
Line and scatter plots of datasets on two axes | Chart |
Calendar |
A month, with a style for each event date in events |
Monthly |
Scrollbar |
The position in content that is longer than its area | Scrollbar |
Paragraph |
Text that wraps, aligns and scrolls | Paragraph |
Figure |
Lines, circles, rectangles, points and maps on a plane with coordinates | Canvas |
The xnano.widgets reference gives the arguments of each
widget.